This unit introduces an extremely simple exercise that allows students to think more deeply about the concept of a threshold and how to use it to make a robot react to its environment.
It is based on my Teachers Introduction Course to LEGO® MINDSTORMS NXT & EV3 at BOGATECH’s website. Here the programming examples are based on the LEGO MINDSTORMS EV3 Software, but at BOGATECH’s website you can find the NXT version and the differences between the two platforms, if you are interested.
The following exercises can even be done by students without any programming experience, with the goal of introducing the concept of a threshold and programming with logical structures. It is very interesting to observe that in this practical exercise, the challenge is not to program the Wait and Switch blocks, it is to determine the thresholds to be used in each block to make the robot detect the lines and their color correctly. Students could, for example, be given the program already written. Students typically understand these blocks very intuitively and with little explanation.
At the end the unit, an experiment is proposed to generate a graph based on the color sensor’s measurements. This graph perfectly illustrates the sensor behavior. This approach can be extrapolated to other sensors.
A little bit of theory
To better understand how a sensor works and how the EV3 makes decisions based on sensor values, we need to explain the concept of a threshold.
A very simple example is to use the classroom doorway to illustrate that depending on where we stand, we will either be inside or outside the classroom. But if we stand just in the middle of the doorway, where will we be? We will be at the door’s threshold which separates the inside from the outside.
For another example, let’s imagine that we want to classify the students by separating the short from the tall ones. One way to do it is to take the tallest student and the shortest one, draw two lines on the blackboard at their heights and ask the class where to draw the line that will separate the short from the tall students? In other words, how can we calculate the threshold that will state the difference between a short and a tall person? Perhaps the easiest approach would be to find the mean of the two extremes, that is to simply add the two measurements and divide the result by 2, that is, (A+B) / 2.
We can also calculate the arithmetic mean of the whole class, by adding all the students’ heights and dividing the result by the number of students. That will typically give us a different result, but why? When should we apply this concept? We could also add different weights to the different measurements, but how and when should we do this?
To calculate the threshold required to differentiate between a pair of sensor measurements is very similar, but first we need to find out the values of the sensors we want to differentiate. As outlined below, we can use the View menu on the EV3 brick to read the value of the Color sensor when we place it on top of different colors. Similarly, we could read the volume level on a Sound sensor or the distance to an object in front of the Ultrasonic sensor.
Exercise overview
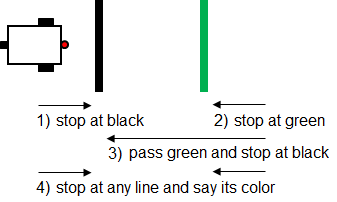 As shown in this image, the exercise consists of finding the right thresholds to make the robot…
- Go forward and stop when it finds the black line, using only a Wait block.
- Do the same exercise but stopping at the green line.
- Go over or “jump” the green line and stop at the black line.
- Stop at any line (green or black) and, using a Switch based on the value of Reflected Light Intensity of the Color sensor, it has to say the color of the line using a Sound block.
Preparation
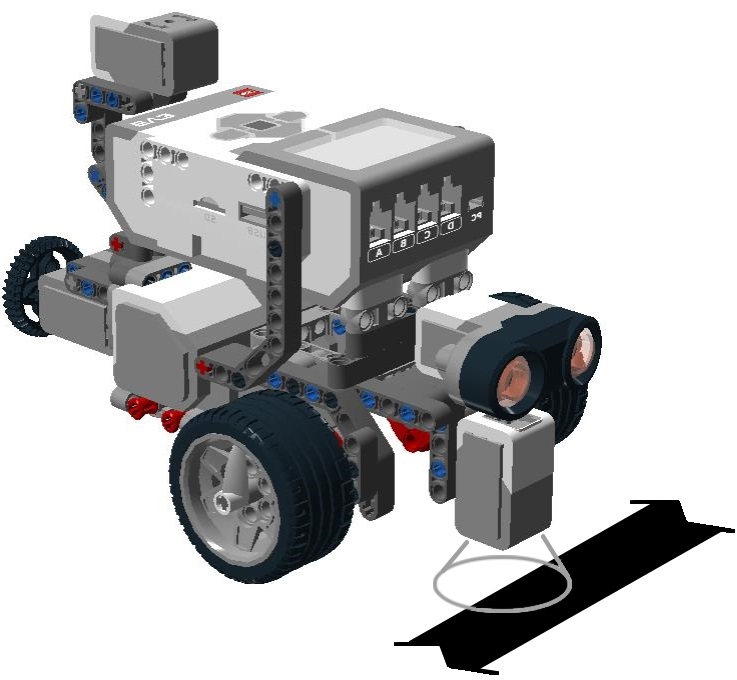
We need to tape a black line onto a white background. We also need another color line (e.g. green or blue) that will give a reflected light intensity higher than black and lower than white. In the following exercises we will use several thresholds, but always between pairs of measurements corresponding to two different colors.
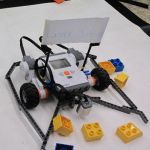
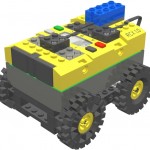
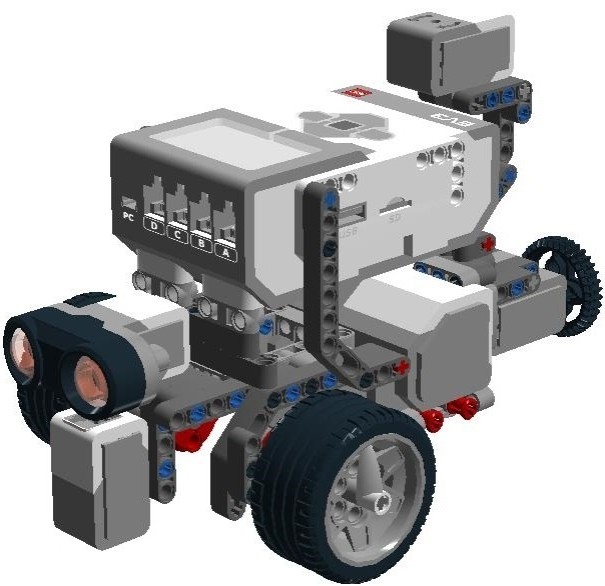 Each team will need a simple two-wheeled robot with a Color sensor (to be used as a light sensor) attached to the front of the robot, as shown in the image (e.g. LEGO MINDSTORMS Education EV3 Software > Robot Educator > Driving Base + Color Sensor Down).
Next, every student or group of students will need to fill in a table with their robot’s sensor readings on top of the white, the green, and the black colors (the readings might differ for each sensor) – by using the “View” option of the EV3 brick, selecting “Reflected Light” and choosing the corresponding port of the color sensor – and calculating the thresholds between each pair of colors. At this point it is important that the students make some tests and realize that the reading of the Color sensor’s reflected light intensity on the same color or point can vary depending on differences in lighting in the room or the position of the robot.
| Black | Threshold Black-Green | Green | Threshold Green-White | White |
| 6% | 7% | 9% | 42% | 75% |
| Threshold Black-White | ||||
| 40% |
Exercise 1: Stop at black
The first three exercises deal with varying the light intensity threshold of the Wait block to stop the robot at the desired lines.
Create a new program and add…
- a “Move Tank” block set to “On” and 40% power,
- a Wait block set to Color Sensor > Compare > Reflected Light Intensity, and
- a final “Move Tank” block to stop the robot.
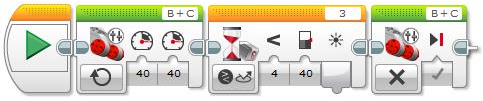
Suggestion: We can use a “Move Tank” block to control both motors with only one block. Remember to check that the ports for the motors and color sensor are set correctly.
As we can observe, this first exercise will make the robot stop at the black line, and obviously we must use the threshold between black and white, for example 40%. Make sure that “Reflected Light Intensity” in the compare Color sensor option is selected.
Exercise 2: Stop at Green
For the second exercise, that is, to stop the robot at the green line, you might expect that we need to use the threshold between green and white, e.g. 42%. But if we do not change the previous threshold, will the robot stop at the green line? The answer is yes because the value of the reflected light intensity read by the color sensor on the green is 9%, a value which is still under the threshold between black and white, e.g. 40%.
Exercise 3: Ignore green, stop at black
The third exercise is more interesting because now the students need to think a little bit to put a threshold that will make the robot go over or “jump” the green line without stopping, but then stop when it reaches the black line. To do this we need to put the threshold between black and green, e.g. 7%.
Exercise 4: Stop at any line, say its color
Finally, the fourth exercise, stopping the robot at any line and making it say its color, will allow the students to finish the reflection on the threshold concept, as we will see next.
To make this fourth and last exercise, we need to add a Switch block, also set to use the Color sensor. Now, the first Wait block will stop the robot at any colored line (in our case black or green) and the switch will find out the color of the line. Once the Wait and Switch blocks settings and operation are explained, the students need to find out the thresholds they need to put in each case to correctly do the exercise. If the students do not have any programming knowledge, it is important to let them make tests, make mistakes and think about what they do.
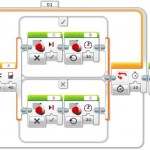
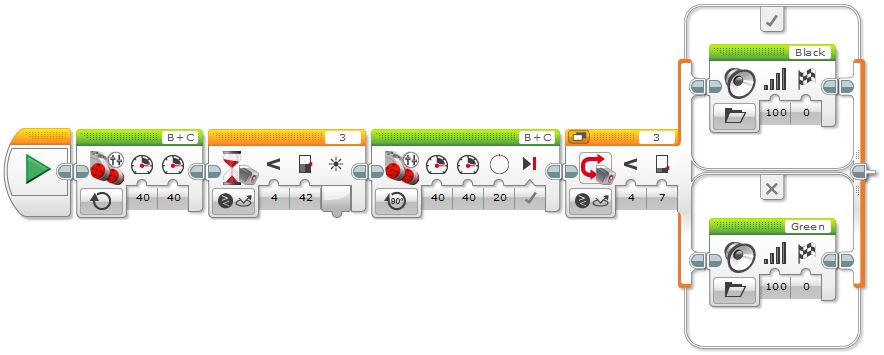
The students need to discover that to make the robot stop at any line, they need to set the value in the Wait block to the threshold between white and the lightest line, in our case the green line, 42%. In this way, if the robot stops at green, it will also stop at black. But in the Switch block, they need to put the threshold between the colors we want to differentiate, in our case green and black, 7%, as shown in the following image.
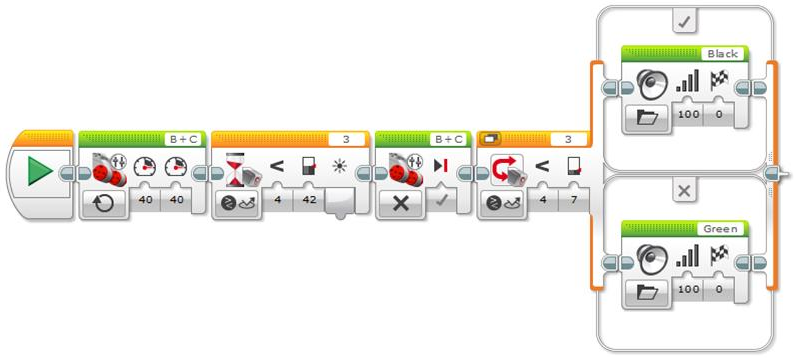
Note that inside the Switch, in the darker color branch we need to add a Sound block and choose File > Black to make the robot say this word, and in the corresponding branch to the lightest color we need to choose File > Green.
The question is: will the robot say the right color? The answer is: not yet. Let the students make tests and discover that if they put the robot directly on top of each line, the robot does not move, given that it is already on the line, but it says the color correctly. Why? It is important to let them build up their theories and discuss them among themselves.
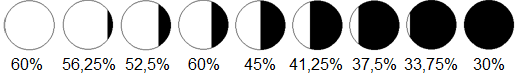
 The reason is that the value of the Color sensor measurement during the color change is progressive. That is, the value does not change suddenly. This is due to the fact that the sensor progressively varies its position over the colors as the robot goes forward, and that produces a progressive change of the reflected light intensity value read by the Color sensor, as the following images demonstrate.
Given that the Color sensor reading of the reflected light intensity is progressive, when the robot stops, it does it at the threshold of the lightest line, thus, the robot will always, or almost always, say green.
What do we need to do to make the robot say the right line color? The students very quickly understand that they need to stop the robot just on top of each line so as the color sensor will read the color with all its intensity and, thus, it will say its name correctly. The solution is simple, we must make the robot go a little bit forward just after the wait block, instead of immediately stopping it, as shown in the image below.
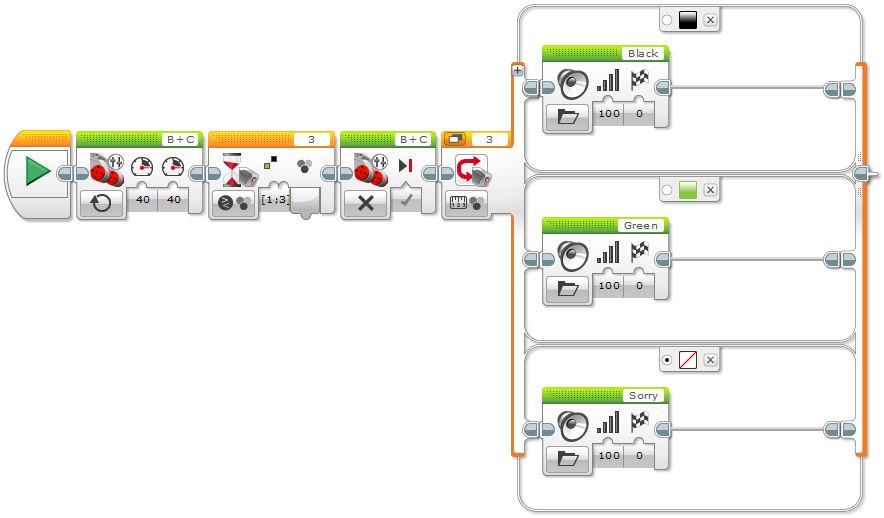
But there is another way we can differentiate colors using the Color sensor in EV3. We can use the “Compare Color” mode in the Wait block and the “Measure Color” mode in the Switch block. The Wait block allows specifying the set of colors we want to find and the Switch block allows adding several branches, one for each color we want to differentiate.
Note that we can also add a default branch with “No Color”, just in case the robot finds a different color from the ones we are interested in, and since this is the default branch, the robot will use it for those colors that do not match the other branches. But, will the program ever execute this default branch at all? The answer is no, because the Wait block will never stop at any color other than black or green! If you have some blue tape, for example, you can test this. Although in this specific problem having a default option in the Switch block is not really useful, it might be very interesting for other situations.
Finally, observe that after the Wait block is executed, we do not need to move the robot a little bit forward to ensure that it stops just on top of the line, as we previously did when using the sensor in the “Reflected Light Intensity” mode, because in the “Compare Color” mode the Wait block takes care of reading the color correctly.
A graphical exploration of thresholds
Finally, to better understand the Color sensor operation, its readings, and the use of thresholds, we can create an “Experiment” in the MINDSTORMS EV3 Software. Experiments allow us to record data from one or more sensors over time and generate a graph of the recorded data automatically.
The software allows us to record data in a number of ways, including:
- Dynamically, by having the robot connected to the computer via USB or Bluetooth, the graphs are generated in real time, making it easy for the students to relate the movement of the robot with the resulting graph to understand it better.
- Programmatically, by using specific data logging blocks. After the experiment is run we can access the data to visualize and study it in the computer.
The advantage of the first method is that the graphs are seen in real time and you can change the configuration in the same window where the experiment is displayed. But if you cannot have the computer connected via USB or Bluetooth, or if you need to run an experiment or record data after an event is triggered by a sensor, or given specific conditions, then you may need to generate an experiment using the data logging blocks programmatically.
For the pedagogical purpose of this unit, we will do both methods, but we will start by doing the programmatic approach first, so as not to unveil the “magic” until the end.
A little bit of theory
Before running any experiment, it is very instructive to ask the students to sketch the graph the robot will generate. We can help them by drawing a straight line at the height of the white color, at 60%, and another one at the height of the black one, at 30% (these values are just an example).
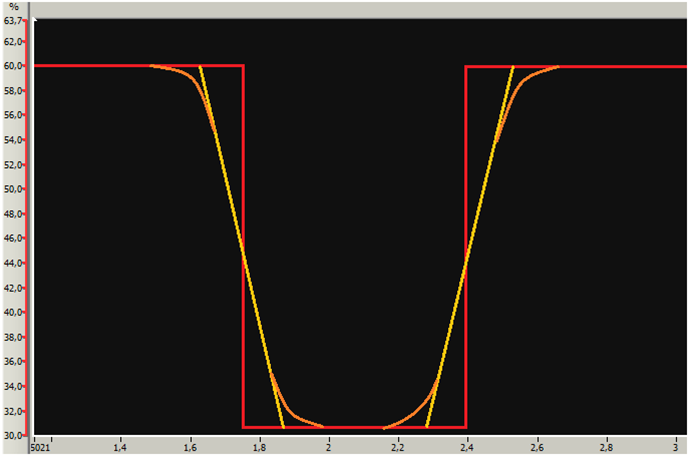
Very soon the students will realize that the color change does not happen abruptly going from white to black, as the vertical red line shows, and they propose the inclined yellow line. This is a very important step because they relate the concept with the graph. In fact, in reality, the sensor readings draw a curve like the orange curves show (this effect is more noticeable when using the light sensor of the NXT brick).
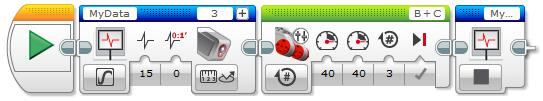
Exercise 1: Programmatic graphical exploration
To record the data read by the Color sensor programmatically, we just need to use a Move Tank block with enough rotations to go over the black and the green lines, with a power of 40%, and two Data Logging blocks. In the first Data Logging block we need to choose the number of samples per second, e.g. 15, and the Color sensor with its port using the “Reflected Light Intensity” mode. Note that the duration, or mode, is set to “On” because we want to collect the data for as long as the robot moves, and stop it when the robot stops.
To retrieve an Experiment from the EV3 brick, we have to create a New Experiment window, turn the Oscilloscope mode “Off” and click the “Upload” arrow icon in the bottom right corner of the window to access the brick memory as shown in the images below. Note that you might get several “.rdf” Experiment files, with the same “root” name but with a different number, depending on the number of times you have repeated the same experiment.

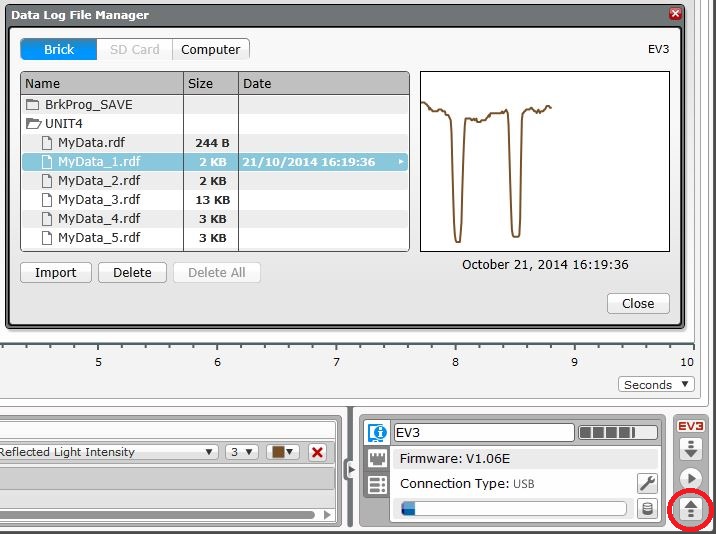
and the “Upload” arrow icon to open it in the bottom right corner
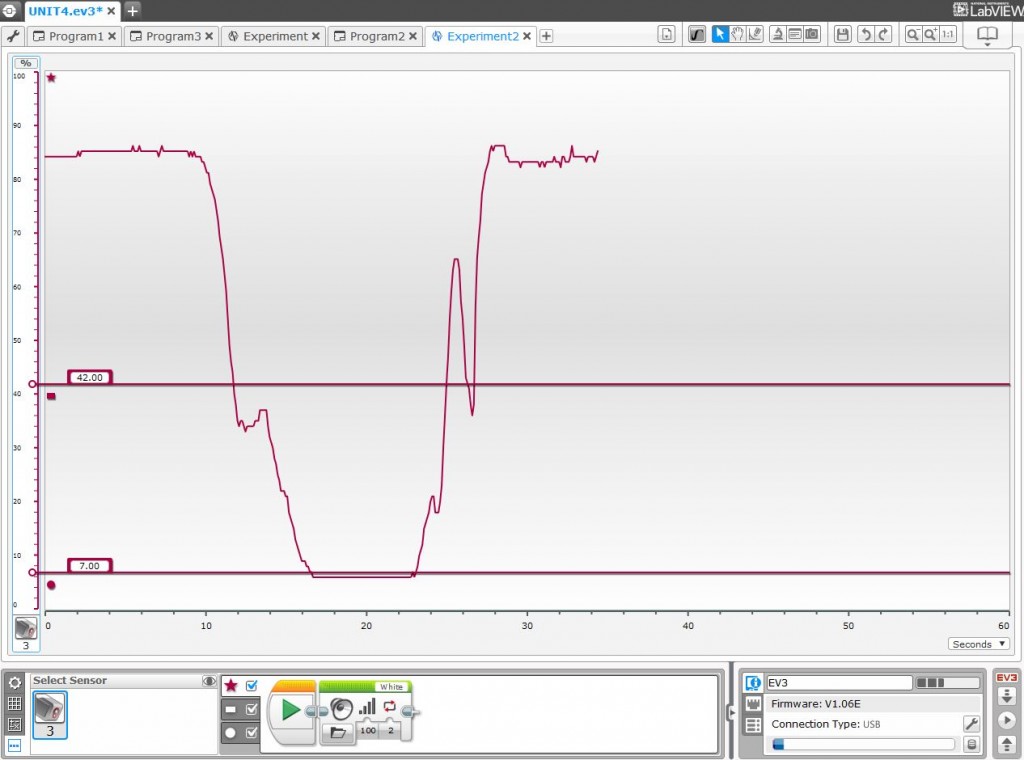
If we run the robot over both colored lines, we will see that the graph shows two steep valleys. At this point it is important that the students interpret the results. For example, can you tell from the following graph whether the robot crossed the green or black lines first?
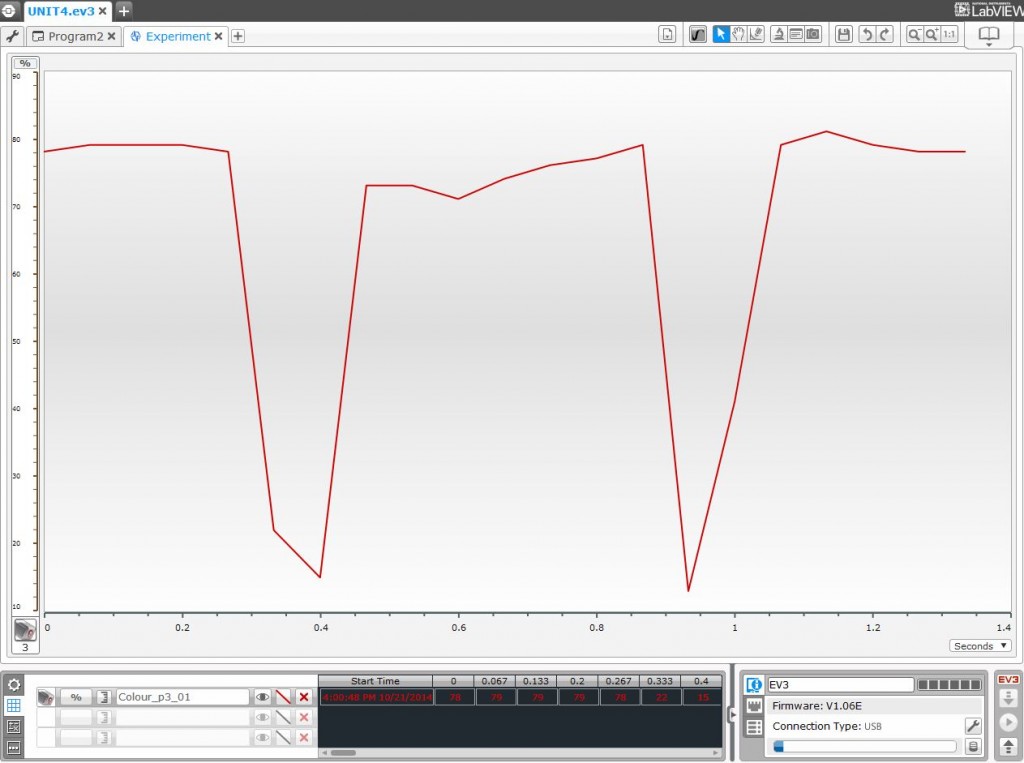
In this case, the first and longer peak corresponds to the black color and the second to the green.
What else can we notice about these graphs? In addition to observing small variations of the white color, one question might be: why is the graph so jagged, rather than being more rounded? Were we wrong with the previous predictions? If we were not wrong, then how can we obtain more precise or meaningful results, where we will better see the shape of the curve? The answer is that to obtain more precision and more meaningful curves we have to increment the number of samples per second. Alternatively, or in addition, we can reduce the speed of the robot.
For the following graph, the experiment ran with 30 samples per second (double of the previous one) and a motor power of 20% (half of the previous one).
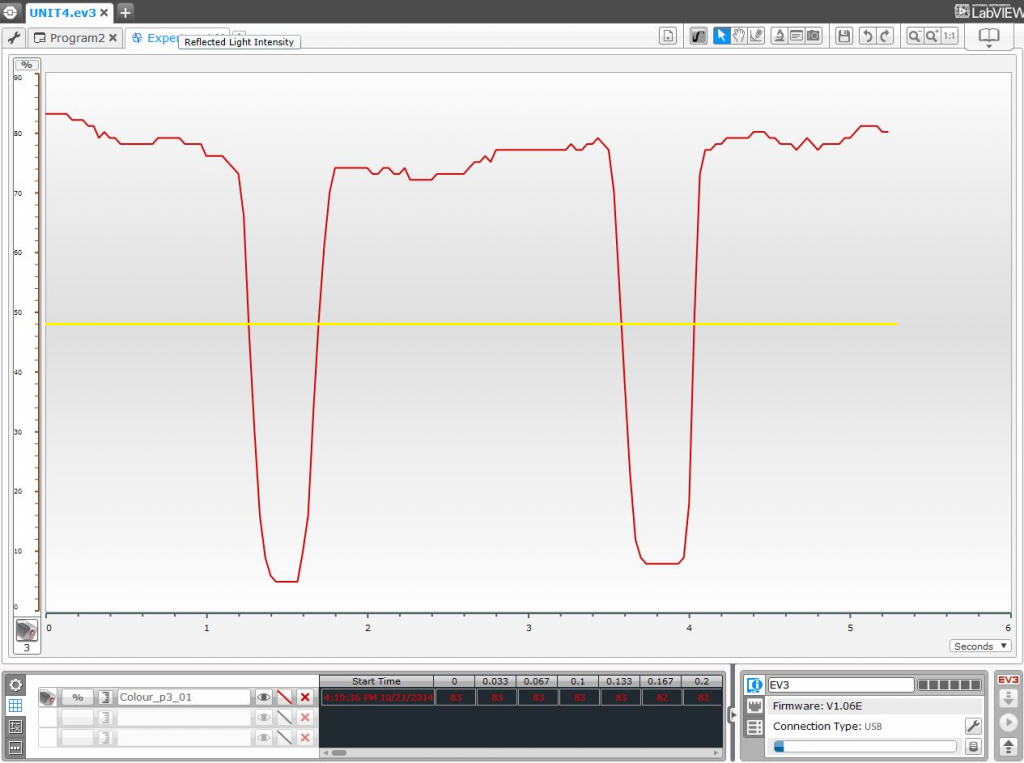
In this experiment we can see color sensor readings through the experiment much more clearly. We can also see that the readings along the top of the graph, that were all of the same color, are not always the same. Why does this happen? It is interesting to make the students think about what factors they believe have an influence on these color sensor reading variations. Some factors to consider may include dirt or other marks on the surface, lighting conditions, and the sensor reading errors. Note that the reflected light readings along the darker areas are more stable than along the lighter areas.
Finally, we can see and understand visually where the robot stops at each line, which is at the threshold between white and the green line, represented by the yellow line in the previous image. Thus, when reaching the black line the robot will stop a little bit before the border of the line, and when reaching the green line, it will stop right on the border of the line, since it is precisely the threshold between green and white, as we have mentioned before.
Exercise 2: Dynamic graphical exploration
As mentioned before, if we keep the robot connected to the computer via USB or Bluetooth, we can do the experiment dynamically to watch how the graphs are generated in real time, allowing the students to relate visually the movement of the robot with the graph being generated to understand it better.
To dynamically watch the generation of the graph, we can turn “On” the “Oscilloscope” mode in a new Experiment window (this is done by default when opening a new experiment window). Let the students play within the Experiment window generating graphs for the Color sensor, watching how the reflected light reading changes as they push the robot by hand over the different colors on the field.
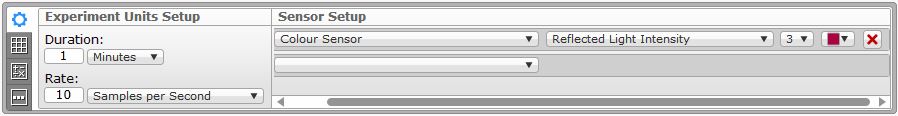
Suggestion: Disconnect any extra sensors from the EV3 brick before creating a new Experiment, leaving only the Color sensor connected. When a new Experiment is created, the software automatically fills the Sensor Setup configuration for each of the connected sensors. Alternatively, you can remove the sensors you are not interested in by clicking in the red cross on the right of each entry. Finally, make sure that the Color sensor is connected to the right port (default port 3 in our case) and that the mode is set to “Reflected Light Intensity”. Note that if you have previously configured the Port View settings for any sensors (in the lower right of the EV3 window), then the Sensor Setup will be filled with the same parameters used there.
Finally, to fully understand the exercise and how thresholds work with the Color sensor over different color lines, let us unveil the “magic”…
The EV3 Software has a very useful and easy to use feature called “Graph Programming”. This allows us to dynamically run a program within an Experiment establishing up to three different area or zones, divided by two thresholds, running specific code in each zone. Just click on the Graph Programming tab, in the bottom left of an Experiment window, select the Color sensor, and you will see three different zone markers (star, rectangle and circle). After selecting the checkboxes of the three zones to make them available, you will see two horizontal lines dividing the screen. Just type in the desired thresholds in the left textbox of each line, in our case, 42 and 7, as shown in the image below.
Next, we need to select the programming blocks we want to run in the three different areas (above, between, and below the two thresholds). What do we want the robot to do? The idea is to make the robot say the color of the line continuously, as shown below, so that it will say different color names while it is pushed through the field, crossing the two thresholds.
Note that in the first area, the top one, the Color sensor is supposed to be on top of white, thus the robot needs to say “White”. In the middle area the robot detects green, thus the robot will have to say “Green”, and in the bottom area the robot will detect a reflected light intensity near black, thus the robot will have to say “Black”.
Finally, run the Experiment by turning the oscilloscope mode “On” and put the robot on top of white. The robot will say “White” continuously. Now gently push the robot towards the black line. Guess what will happen… If you go slowly you will hear the robot say “Green”!, but if you continue pushing it towards black, it will start saying “Black” until you remove it from the line. Now you can also place the robot near green and push the robot to check that it will always say green… This reveals, in a very practical manner, the Color sensor readings’ progression in reflected light intensity mode and its effect when using thresholds to find out line colors.
To finish the unit, if you would like to reproduce the smoothness of the programmatic experiment graph dynamically, you just need to run a “Move Tank” block in the robot while running the Experiment with the robot connected to the computer. This will ensure that the speed of the robot is constant through the whole experiment, thus, ensuring that the graphs are generated at a constant speed.
Acquired knowledge
With this exercise the students have learnt to interpret a graph, to better understand how sensors operate, as well as the concept of a threshold, and how to use a threshold to program a robot to make decisions in response to the environment. Also important is the mental and intellectual effort needed when trying to deduce the results before doing an exercise, and then to later prove them practically. This helps the students to assimilate the acquired knowledge much more effectively and puts their mental gymnastics into practice.
Latest posts by Josep Fargas (see all)
- Write Better Code with Design Patterns in EV3 - 14 February 2019
- How to Toggle a Motor On/Off With a Touch Sensor - 16 November 2017
- How to Wait for More than One Sensor Condition - 19 October 2017
- To light or not to light - 7 July 2016
- From Sequential Programming to State Machines - 14 April 2015