These examples (PDF) demonstrate the use of sensors in LabVIEW.
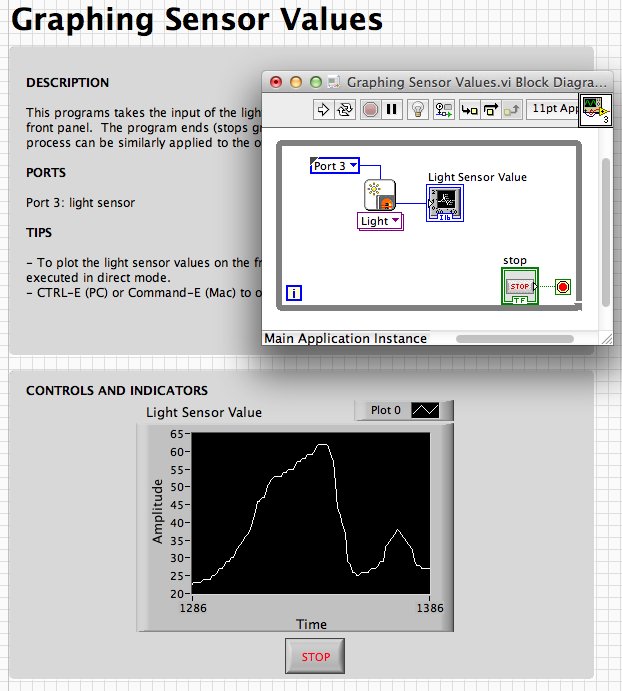
Graphing sensor values
- This program takes sensor values and graphs them on the front panel.
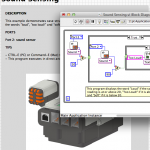
Line follower
- This program is provided in the “Behaviors” section of LabVIEW 2010. It can be very useful in more advanced projects, such as creating an NXT Trolley (a vehicle that follows a line, and stops with touch or sound.)
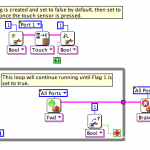
Multiple inputs and outputs
- This example demonstrates how to use multiple sensors and motors to control a vehicle. The while loops and case structures control the movement of the car. The purpose of the nested while loops is to permit holding down the buttons.
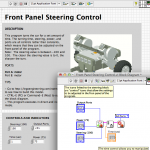
Use Sensor Values
- In this example, the NXT uses the values of the light and ultrasonic sensors to power the motor.
Resources
The following two tabs change content below.

CEEO
The Tufts Center for Engineering Education and Outreach (CEEO) in Boston, Massachusetts, is dedicated to improving engineering education in the classroom, from Kindergarten to college. The Center houses faculty, staff, and graduate students from engineering disciplines and the education department.
Latest posts by CEEO (see all)
- Chair for Mr Bear - 21 August 2020
- Assistive Technology: Making Lives Easier - 20 August 2020
- Sturdy Tower - 14 June 2020
- Going the Distance - 21 May 2020
- GPS accuracy testing with LEGO bricks - 10 September 2015
hello!! where can I find the module to download nxt sensors for labview ?